
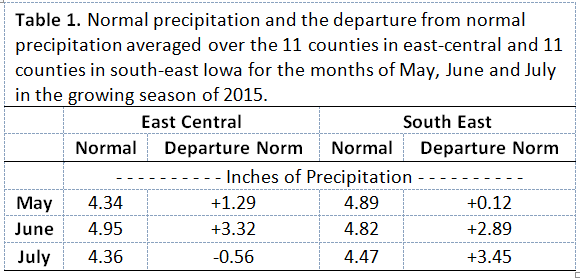
The 2015 growing season was rather wet in parts of east-central and south-east Iowa. Most of the above normal precipitation fell in the last half of May and June in east-central Iowa, whereas the wettest two months in south-east Iowa tended to be June and July (Table 1).
Regardless of when the rain fell, this excess precipitation caused saturated soils and nitrogen (N) loss via leaching and denitrification (loss as N2 or N2O to the atmosphere) leading to corn fields with varying levels of N deficiencies.
Research Summary
- A wet growing season in east-central and south-east, IA led to many fields with saturated soils and N loss, leaving growers and salesman wondering, “Can this crop be saved with extra N fertilizer?”
- Rescue N plots were implemented in three farmers’ fields in eastern, IA to test this idea.
- Rescue nitrogen increased profitability over the zero N control $90, $61, and $16 dollars/acre in severely N deficient corn, moderately N deficient corn, and corn that was not apparently N deficient at the time of rescue N applications.
- The most profitable N rate in the severely N deficient corn, moderately N deficient corn, and corn that was not apparently N deficient at the time of rescue, N applications was 57.5, 71.5, and 44.3 lbs N/ac.
- Rescue N is likely to increase corn yields, but the soil should be given a chance to dry out before attempting rescue N treatments. In other words, applying more N isn’t likely to increase yields if soils continue to stay saturated.
In the field experience
Because of the above normal rain and subsequent N loss, I was asked to visit many fields this summer. A common question from farmers and salesman was, “Can this corn be ‘rescued’ by applying more N?” My response tended to be that the available evidence says it can, but the number of experiments that have been conducted to reach these conclusions are few.
Moreover, we are even less confident that if more N can help this corn crop recover from saturated soils and N loss, how much more N will it take? On top of all this, there is the problem of the nitrogen loss not being evenly distributed across the entire field. In other words, in fields where N loss is caused by standing water—denitrification primarily—it is very common for there to be severely N deficient corn, moderately N deficient corn, and corn that does not appear to be at all N deficient in the same field.
Given these drastic changes in apparent N status of the crop, it would seem plausible that the entire field may not need N—or at least a different rate of N—but that isn’t at this time well-known, either.
It isn’t easy to vary the rate of N across fields such as these. It can be technically done, but the equipment to apply N based on crop canopy color isn’t widely available. As you can see, there are many questions to be asked and few available answers. In addition, these questions have important financial ramifications for farmers, and applying more N that doesn’t result in financial gains will result in environmental pollution. So the main questions we set out to answer are as follows.
Applied Questions
- Can applying more N to corn that’s been previously fertilized and exposed to several days of saturated soils and N loss result in a net profit increase?
- If so, how much additional N does it take?
- In these situations, should the whole field receive additional N, or just parts of it?
How Were the Applied Questions Answered
To answer these questions, we established replicated rescue N rate plots in three different farmers’ fields. All three fields were in Clinton county Iowa, two near the town of DeWitt, and the third close to Andover. Each of these fields had been fully fertilized with N prior to the establishment of these experiments, and the N rates prior to the initiation of these experiments ranged from 179 to near 200 lbs N/ac. In each of these three fields there were three separate N rate plots established. One in what appeared to be severely N deficient corn (stunted completely yellow corn), moderately N deficient corn (normal height but with the classic inverted V-shaped yellow chlorosis in the lower canopy leaves), and corn that did not appear to be N deficient (corn was normal height, and green from top to bottom) when the experiments were initiated.
In each of these levels of N deficiency there were 6 treatments, 4 evenly spaced N rates from 30 to 120 lbs N/ac and a control (zero N applied). Moreover, one treatment was 30 lbs N/ac plus 15 lbs of sulfur per acre. The sources of N and sulfur were liquid urea ammonium nitrate and ammonium thiosulfate dribbled on the soil surface.
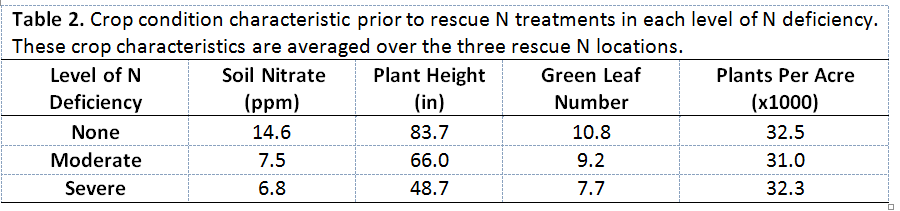
The experiments at each field were established just prior to or after the beginning of reproductive growth (VT/silking). So that you can envision the differences between the severely, moderately, and no apparent levels of N deficiency, I have included a table with the average plant height, average number of green leaves per plant, and the nitrate nitrogen in ppm in the top 2 ft of soil prior to the initiation of the experiments.
Lastly, below are three pictures (picture 1) taken in the same field and at similar distance above the soil surface showing the drastic difference in crop height between the severely deficient, moderately deficient, and corn that did not appear to be N deficient.


Picture 1.
The three different levels of N deficiency symptoms where N rate trials were established at one grower’s field in east-central, IA. From left to right is the severe, moderate, and corn that had no apparent N deficiency symptom at the time of experiment initiation. The dedicated intern in these photos (Ryan Cruise) who helped establish these plots is approximately 5’7” tall.
Results
In these experiments, applying more N to corn that had been previously fertilized and exposed to several days of saturated soils and N loss clearly resulted in net profit returns. Moreover, at the corn and nitrogen prices used here, applying more N to corn increased net profitability in all three levels of N deficiency.
The nitrogen rate that produced the greatest return to N varied some in the three different levels of N deficiency symptoms. In the severe, moderate, and corn with no apparent N deficiency symptoms, the N rate that maximized economic return was 57.5, 71.5, and 44.3 lbs N/ac (Table 3), producing net profit increases over the zero N control of $90, $61, and $16 dollars per acre (figure 1).
While all three levels of N deficient corn were responsive to rescue N applications, the moderately N deficient corn was the most responsive, producing 32.1 bu/ac more corn with N, followed by N increasing the severely N deficient and corn with no apparent N deficiencies 23.5 and 10.1 bu/ac.
This was not a terribly surprising finding, corn that still has good height and a canopy to capture sunlight probably has the best chance of responding to rescue N applications. On the other hand, corn that has had its height and leaf size severely reduced, and presumably yield potential probably needs less N to reach maximum yield. Corn that does not appear N deficient may not always respond to rescue N applications, but it’s possible that good looking corn (none N deficient) at the beginning of reproductive growth can run out of N, as I suspect happened here.
Conclusions
So should we rescue corn next time we think it needs rescued from standing water and N loss? These results sure tend to suggest that, and they align with some University trials conducted by Dr. Peter Scharf at the University of Missouri.
It’s important to keep in mind that corn roots must be actively taking up mineral nutrients if the rescue N is going to make it in the crop, and to do so corn cannot be in standing water that is depleted in oxygen.
Before applying rescue N, it might be worthwhile to wait for the soil to dry some, and to see if standing water kills large portions of the crop, because applying more N to dead corn—or corn that can’t take up the rescue N—sure won’t help.

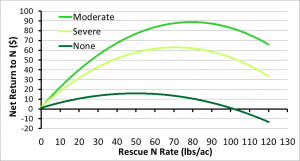
Figure 1.
The net return to rescue nitrogen fertilizer in severely N deficient corn, moderately N deficient corn, and corn that was expressing no apparent N deficiency symptoms at the time of rescue N applications. The curves are the average response of three east-central, IA rescue N locations in the growing season of 2015. The return to N assumes $3.80 corn and $0.48/pound of nitrogen fertilizer.